Best way to debug an STM32 microcontroller
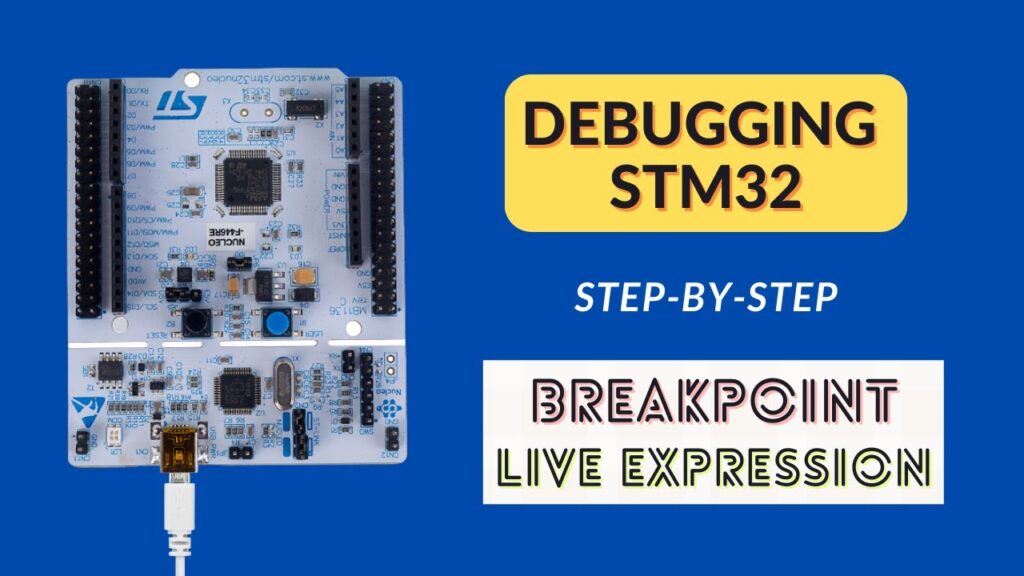
Debugging microcontrollers is a crucial step in ensuring the functionality and reliability of your embedded systems. When it comes to debugging STM32 microcontrollers, there are several tools and techniques that you can use to troubleshoot and fix any issues that may arise. In this article, we will explore some of the best ways to debug an STM32 microcontroller.
1. Use a debugger
One of the most effective ways to debug an STM32 microcontroller is to use a debugger tool. STMicroelectronics provides several debugger tools, such as ST-Link, that allow you to connect your microcontroller to your computer and monitor its behavior in real-time. By using a debugger tool, you can step through your code, set breakpoints, and inspect the value of variables to identify any errors in your program.
2. Use printf debugging
Another useful technique for debugging STM32 microcontrollers is printf debugging. This technique involves using the printf function to output debug messages to a serial terminal. By strategically placing printf statements in your code, you can monitor the flow of your program and identify any issues that may be causing it to malfunction.
3. Use an oscilloscope
If you are working with STM32 microcontrollers that interact with external hardware components, using an oscilloscope can be a valuable debugging tool. An oscilloscope allows you to visualize the signals and waveforms that are being sent and received by your microcontroller, helping you to identify any signal integrity issues or communication errors.
4. Use the Integrated Development Environment (IDE)
Most STM32 microcontrollers are compatible with popular IDEs such as Keil, IAR Embedded Workbench, and STM32CubeIDE. These IDEs provide debugging features such as real-time code execution, register viewing, and peripheral monitoring, making it easier to diagnose and fix issues in your code.
5. Use a logic analyzer
When dealing with complex logic-related issues in your STM32 microcontroller, a logic analyzer can be a helpful tool. A logic analyzer allows you to capture and analyze digital signals, helping you to identify timing problems, protocol errors, and other issues that may be affecting the performance of your microcontroller.
Conclusion
In conclusion, debugging an STM32 microcontroller requires a combination of tools and techniques to effectively identify and fix any issues in your embedded system. By using debugger tools, printf debugging, oscilloscopes, IDEs, and logic analyzers, you can streamline the debugging process and ensure the proper functioning of your STM32 microcontroller-based projects.


